Knowing how people use your application lets you focus your development work on the scenarios that are most important to them, and gain insights into the goals that they find easier or more difficult to achieve. Google Analytics or Azure Application Insights will take you to the next level of analyzing the SharePoint Usage.
In the below example, I am going to show you how to hook up Google Analytics or Azure Application Insights tracker file to track SharePoint Usage in the site collection level using the famous Pnp Provision Engine Template.
Steps to implement
- Extract the PnpCustomAction.zip file and Paste the PnpCustomAction folder on your laptop/server
- Install PnPPowerShellCommands16.msi on your laptop/server. To know more about Pnp Provision Engine click here
- Open the tracking.js(Custom JS action) file and update the script you have copied from Google Analytics or Azure Application Insights
- Upload the tracking.js(Custom JS action) file in your CDN/SharePoint Library. In this example, I have uploaded the tracking.js file in a document library
- Open the Template_Apply_WebCustomActions.xml file and update the URL(the place where you have uploaded the tracking.js file) mentioned in the ScriptBlock attribute under pnp:CustomAction node
- Update the site collection URL in Deploy.ps1 file and execute
- Navigate to different sub-sites under the site collection against where you have executed this script and make sure the tracking data are captured.
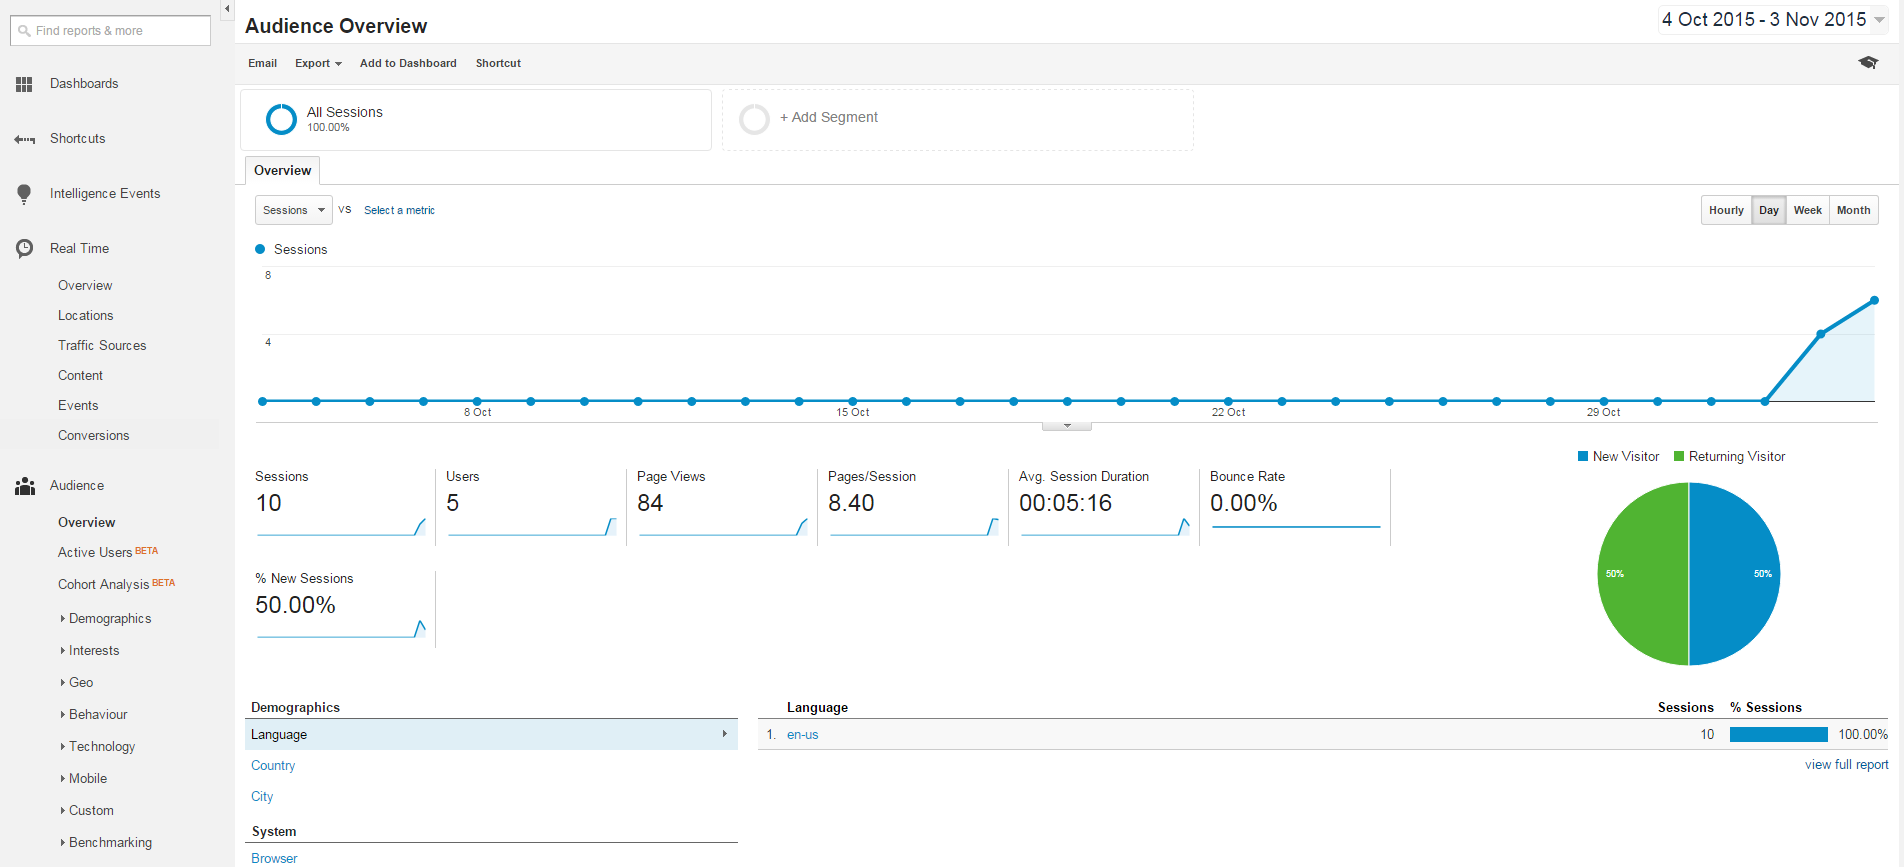
Google Report
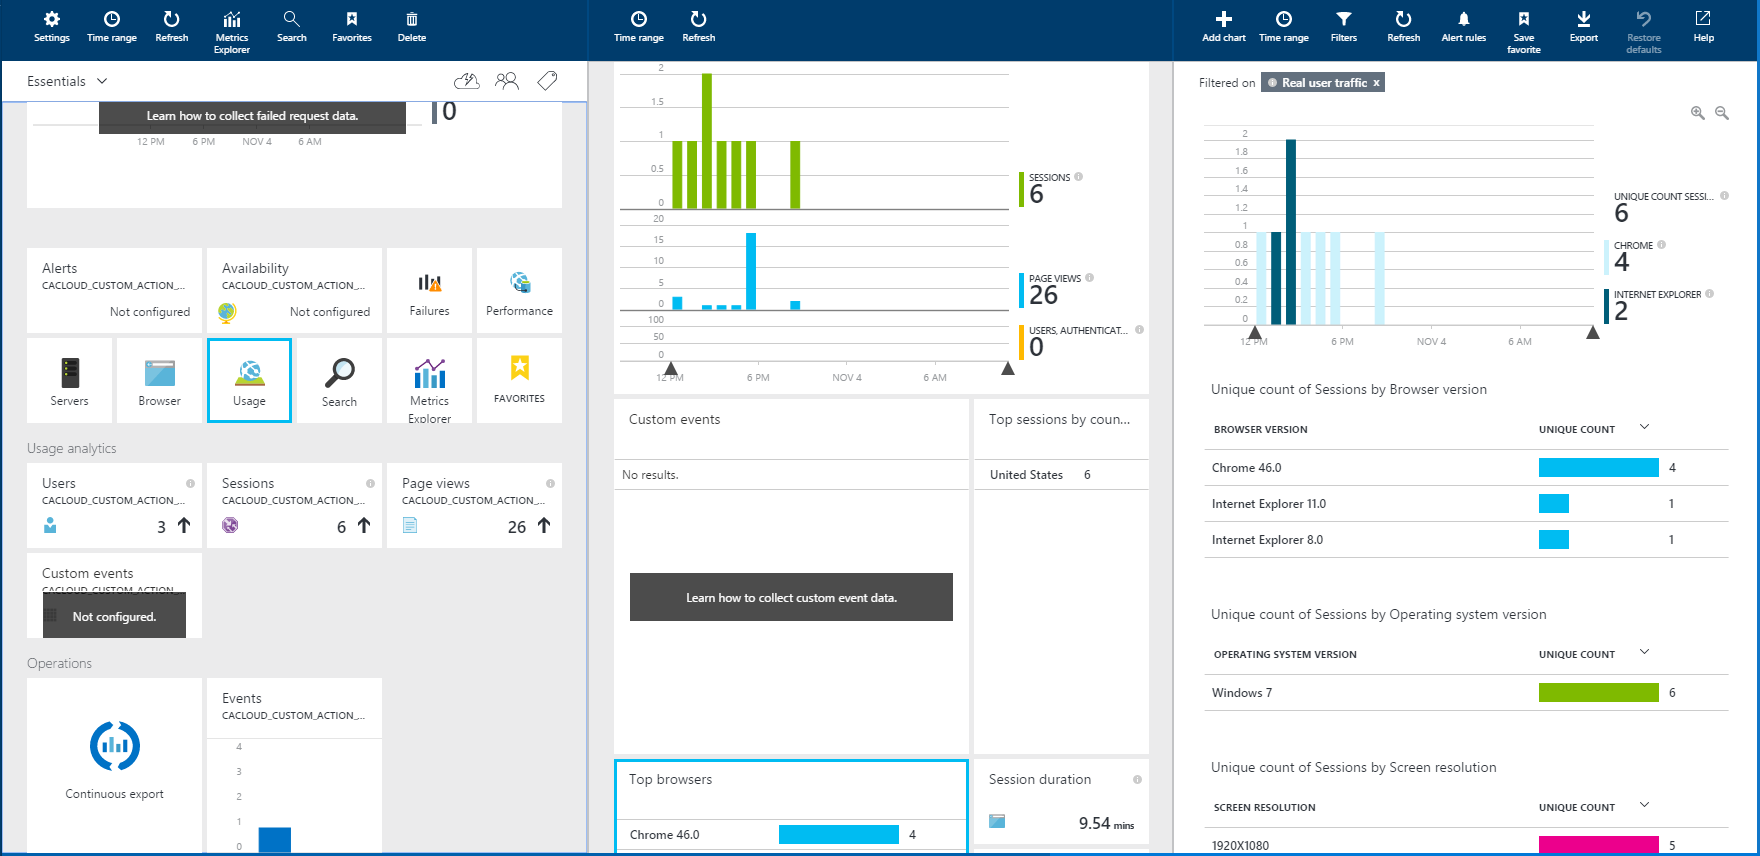
Azure Report
Let me know if you have any queries on this.