In today’s digital landscape, effective logging and alerting are crucial for ensuring the reliability, security, and performance of your applications and infrastructure. One powerful tool that can help you achieve this is AWS CloudWatch Logs. With CloudWatch Logs, you can capture, store, and analyze log data from various sources, including HashiCorp Vault, a popular secrets management tool. In this article, we will explore how to leverage CloudWatch Logs for logging and alerting with HashiCorp Vault, enabling you to proactively respond to critical events.

Understanding CloudWatch Logs and HashiCorp Vault
What is AWS CloudWatch Logs?
AWS CloudWatch Logs is a fully managed service that provides highly scalable and durable storage for log data. It allows you to collect, monitor, and analyze logs from various sources, such as applications, operating systems, and AWS services. CloudWatch Logs offers powerful features like real-time log streaming, advanced search capabilities, and customizable dashboards, making it an ideal solution for centralized log management.
Introduction to HashiCorp Vault
HashiCorp Vault is a popular open-source tool designed for securely storing and managing sensitive information, such as passwords, tokens, and encryption keys. Vault provides a unified interface to access and manage secrets across different applications and environments. With its robust security features and flexible architecture, Vault has become the go-to solution for organizations looking to enhance their secrets management practices.
Integrating HashiCorp Vault with CloudWatch Logs
Please note that the below steps provide a basic setup for both Vault and the CloudWatch Logs. Depending on your specific requirements, you may need to adjust the configurations accordingly.
Launch an EC2 instance
- Log in to your AWS Management Console, navigate to EC2, and launch a new EC2 instance. we will be using the AMI ‘ami-0e820afa569e84cc1’ as the base image for the EC2 instances. Please ensure that you have this AMI available in your AWS account before proceeding with the steps mentioned below.
- During the instance launch, ensure that you configure appropriate security groups to allow inbound traffic to the Vault server on the desired ports. At a minimum, you’ll need to allow inbound traffic on port 22 (SSH) and the port you choose for Vault (e.g., 8200 for HTTPS).
Setting up HashiCorp Vault on AWS EC2
To begin logging and alerting with CloudWatch Logs, you need to set up HashiCorp Vault on an Amazon EC2 instance. This involves installing and configuring Vault on a dedicated EC2 instance, which will act as your secrets management server. To install Vault 1.14.0 64-bit on your Amazon Linux instance, you can follow these steps:
- Connect to your Amazon EC2 instance using SSH.
- Download the Vault binary
wget https://releases.hashicorp.com/vault/1.14.0/vault_1.14.0_linux_amd64.zip
- Unzip the downloaded file
unzip vault_1.14.0_linux_amd64.zip
- Move the Vault binary to the appropriate directory
sudo mv vault /usr/local/bin/
- Start the vault with development mode. This command is primarily used for local development, testing, and learning purposes. When running Vault in development mode, certain security features are disabled, making it easier to experiment and explore Vault’s capabilities.
vault server -dev
Note that the -dev flag is used for development purposes. In production, you’ll need to configure Vault with proper storage and authentication mechanisms.
- In the new terminal window, you can set up the required environment variables, such as
VAULT_ADDRandVAULT_TOKEN, to authenticate and interact with Vault using the root token.
export VAULT_ADDR=http://127.0.0.1:8200
export VAULT_TOKEN=root_token
Replace root_token with the root token generated when you started the Vault in dev mode.
- Run the following command to verify that Vault is running
vault status
Enabling CloudWatch Logs Integration in HashiCorp Vault
Once you have Vault up and running on EC2, the next step is to enable CloudWatch Logs integration. This integration allows Vault to send its log data to CloudWatch Logs for centralized storage and analysis. To enable CloudWatch Logs integration, you can leverage the Vault CloudWatch Logs agent, which provides a seamless way to ship Vault logs to CloudWatch.
To install the CloudWatch agent on an Amazon Linux AMI, you can follow these steps:
- Update the package lists and install the CloudWatch agent
sudo yum install -y awscli
sudo yum install -y amazon-cloudwatch-agent
- Configure the AWS CLI with your AWS credentials
If you have already attached an IAM role to the EC2 instance with the appropriate permissions for sending logs to CloudWatch Logs, there is usually no need to configure the AWS CLI (using aws configure) on that instance. In this section, we are running aws configure to provision certain AWS services necessary for this specific use case.
aws configure
Follow the prompts to enter your AWS Access Key ID, AWS Secret Access Key, default region, and output format.
Configuring Log Group in CloudWatch Logs
With the CloudWatch Logs integration enabled, it’s time to configure log groups in CloudWatch Logs. Log groups serve as containers for organizing log streams. By defining appropriate log streams and log groups, you can organize your Vault logs in a structured and manageable manner.
Create CloudWatch Log Group
To create an AWS CloudWatch Log Group using the AWS CLI, you can follow these steps:
- Open a terminal or command prompt.
- Run the following command to create the log group
aws logs create-log-group --log-group-name vault_audit_log --region us-east-2
Replace vault_audit_log with the desired name for your log group. Make sure to specify the correct region using the --region parameter.
-
The command will create the log group in the specified region. If the command is successful, you will not receive any output.
-
You can verify the creation of the log group by checking the CloudWatch console or by running the
aws logs describe-log-groups --region us-east-2command.
Setup Vault Audit Device
A Vault Audit Device refers to a mechanism or component within HashiCorp Vault that captures and stores audit logs. Audit logs contain information about the operations and activities performed within Vault, such as authentication attempts, secret access, policy changes, and more. The Audit Device in Vault allows you to configure different destinations or backends to store these logs, such as a file, syslog, or a specific external system.
By enabling auditing in Vault and configuring an Audit Device, you can maintain a record of all actions and events within the system, providing visibility, compliance, and security for your Vault deployment. Audit logs are crucial for monitoring and troubleshooting purposes, as well as meeting regulatory requirements and ensuring the integrity of your secrets management infrastructure.
To set up a file-based audit device in HashiCorp Vault, follow these steps:
- Create a new log file
sudo touch /var/log/vault_audit.log
- Set the necessary permissions for the vault_audit.log file
sudo chown ec2-user:ec2-user /var/log/vault_audit.log
- The audit enable command enables an audit device at a given path.
vault audit enable file file_path=/var/log/vault_audit.log
- You can check the file’s existence and logs pushed by Vault using the following command
cat /var/log/vault_audit.log
CloudWatch agent configuration
- Create the CloudWatch agent configuration file:
sudo vi /opt/aws/amazon-cloudwatch-agent/etc/amazon-cloudwatch-agent.json
In this file, you can define your log groups and log streams. Here’s an example configuration:
Customize the configuration based on your log file path, log group name, and desired settings. You can define multiple log files and log configurations in this file.
{
  "agent": {
    "run_as_user": "root"
  },
  "logs": {
    "logs_collected": {
      "files": {
        "collect_list": [
          {
            "file_path": "/var/log/vault_audit.log",
            "log_group_name": "vault_audit_log ",
            "log_stream_name": "{instance_id}"
          }
        ]
      }
    }
  }
}
- To ensure that the EC2 instance has the required permissions to interact with CloudWatch Logs, create a new IAM role named
CustomRoleForHashiCorpVaultToSendLogswith theCloudWatchLogsFullAccesspolicy attached in theus-east-2region.
aws iam create-role --role-name CustomRoleForHashiCorpVaultToSendLogs --assume-role-policy-document "{\"Version\":\"2012-10-17\",\"Statement\":[{\"Effect\":\"Allow\",\"Principal\":{\"Service\":\"ec2.amazonaws.com\"},\"Action\":\"sts:AssumeRole\"}]}" --region us-east-2

aws iam attach-role-policy --role-name CustomRoleForHashiCorpVaultToSendLogs --policy-arn arn:aws:iam::aws:policy/CloudWatchLogsFullAccess --region us-east-2
- Modify your EC2 instance and attach the role.
aws ec2 associate-iam-instance-profile --instance-id i-0ed3e6091695880d1 --iam-instance-profile Name="CustomRoleForHashiCorpVaultToSendLogs" --region us-east-2
Replace i-0ed3e6091695880d1 with the instance ID of the EC2 instance you want to modify.
- Start the CloudWatch agent service
sudo systemctl start amazon-cloudwatch-agent
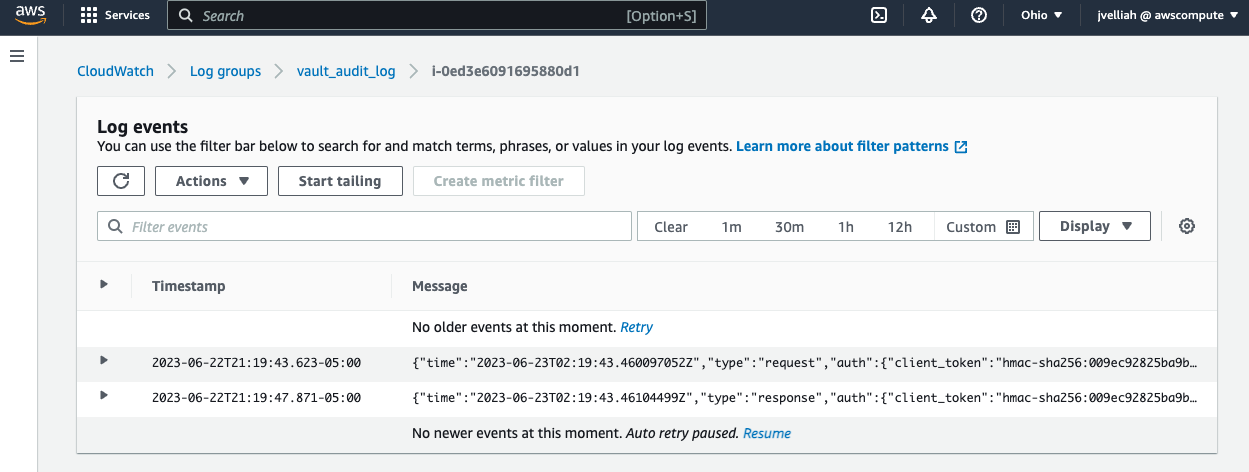
The agent will now start monitoring the configured log files and send the logs to the specified CloudWatch Log Group.
- You can enable the agent service to start on system boot
sudo systemctl enable amazon-cloudwatch-agent
That’s it! You have successfully set up HashiCorp Vault on Amazon Linux and installed the AWS CloudWatch agent to send logs to CloudWatch.
Setting Up Alerts and Notifications
Configuring Log-Based Metric Alarms
CloudWatch Logs enables you to set up metric alarms based on your log data, empowering you to proactively detect and respond to critical events. By configuring log-based metric alarms, you can define thresholds and conditions that trigger alerts when specific log patterns or metrics exceed predefined thresholds. This allows you to take immediate action and mitigate potential issues before they impact your applications or infrastructure.
Now that we have data populating from our Vault server into CloudWatch Logs, we can create some metrics to alert us when certain events happen.
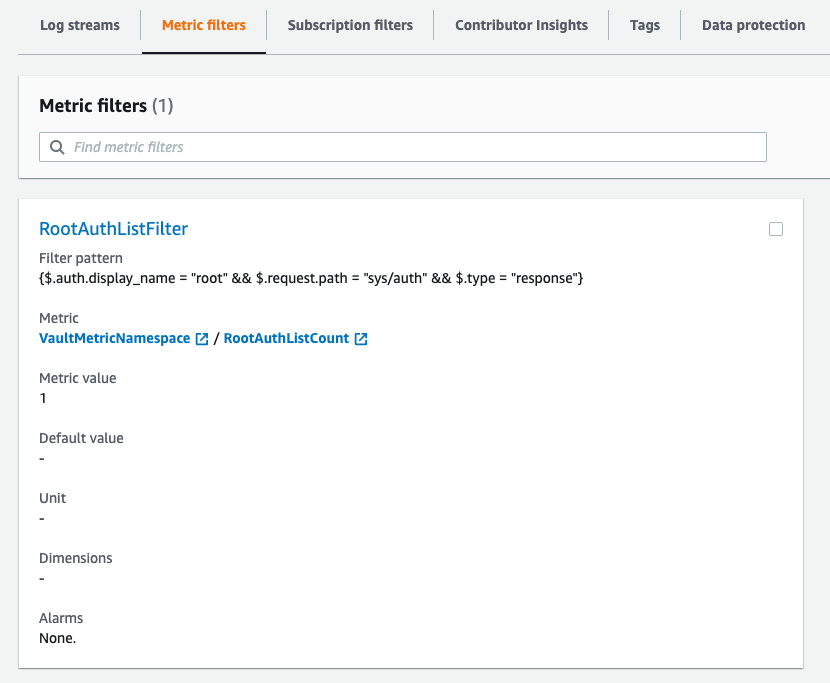
With this metric filter, CloudWatch will capture logs that meet the criteria of the filter pattern, specifically when the root user performs the action of “vault auth list.” You can use this metric to set up alarms, perform monitoring, and analyze the root user’s activity related to this action.
- Run the following AWS CLI command to create the metric filter:
aws logs put-metric-filter --log-group-name vault_audit_log --filter-name RootAuthListFilter --filter-pattern '{$.auth.display_name = "root" && $.request.path = "sys/auth" && $.type = "response"}' --metric-transformations 'metricName=RootAuthListCount,metricNamespace=VaultMetricNamespace,metricValue=1'
Replace vault_audit_log with the name of your CloudWatch log group and VaultMetricNamespace with the desired namespace for your metric.
- After executing the command, CloudWatch will create the metric filter with the specified filter pattern. It will generate a metric named RootAuthListCount with a value of 1 for matching logs.
Integrating CloudWatch Logs Alarms with AWS SNS
To receive timely alerts and notifications from CloudWatch Logs, you can integrate CloudWatch Logs alarms with AWS Simple Notification Service (SNS). SNS provides a flexible and scalable way to send notifications via email, SMS, mobile push, or even HTTP endpoints. By configuring SNS topics and subscriptions, you can ensure that the right individuals or systems receive alerts when critical events occur.
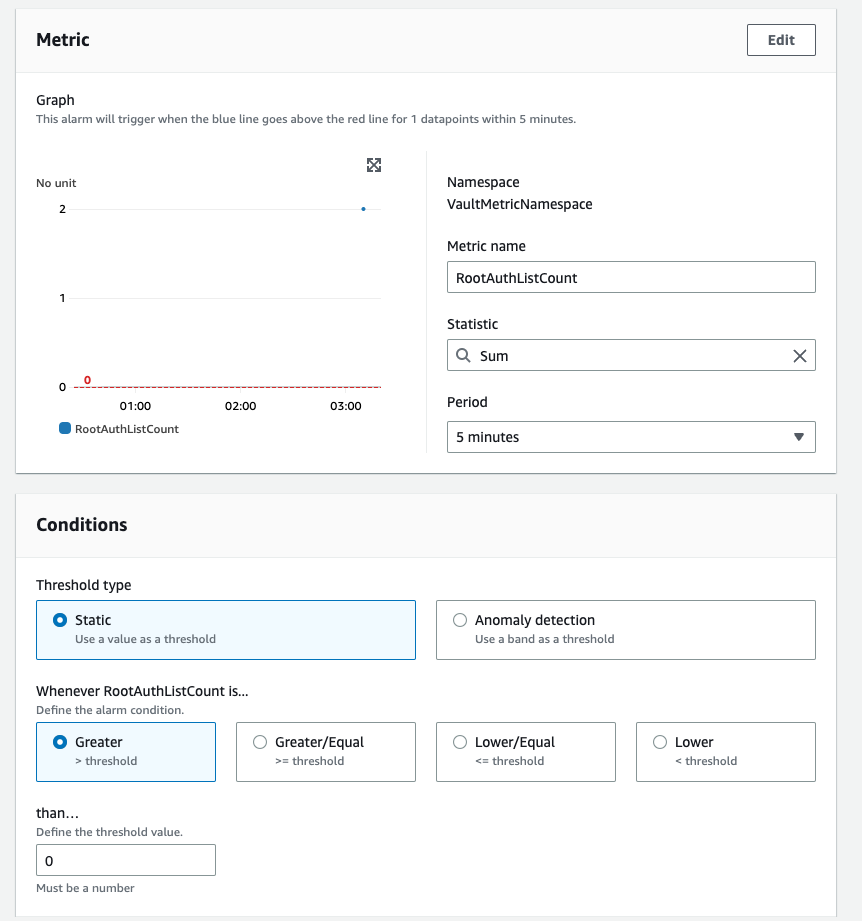
To create an alarm based on the metric RootAuthListCount in CloudWatch, you can use the AWS CLI or console. Here are the steps to create an alarm using the AWS console:
- Open the CloudWatch console.
- In the navigation pane, choose “Alarms” and then click the “Create Alarm” button.
- In the “Create Alarm” wizard, configure the alarm settings as follows:
To test the alarm, you can set the alarm threshold to a low value, and trigger the condition that will exceed the threshold. This will generate an alarm state, and CloudWatch will send a notification to the root account’s email address.
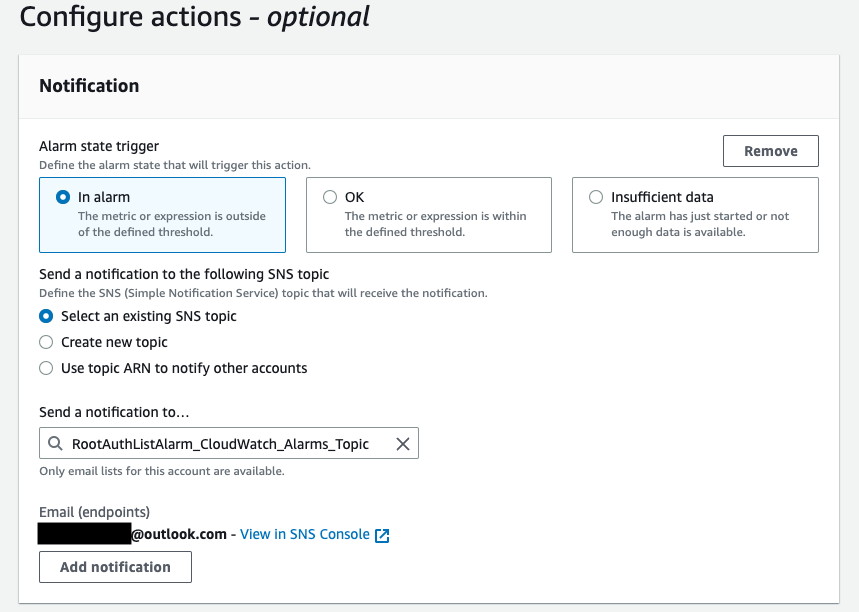
Please note that in this setup, an existing SNS topic named RootAuthListAlarm_CloudWatch_Alarms_Topic is used to send email notifications when the alarm state is triggered.
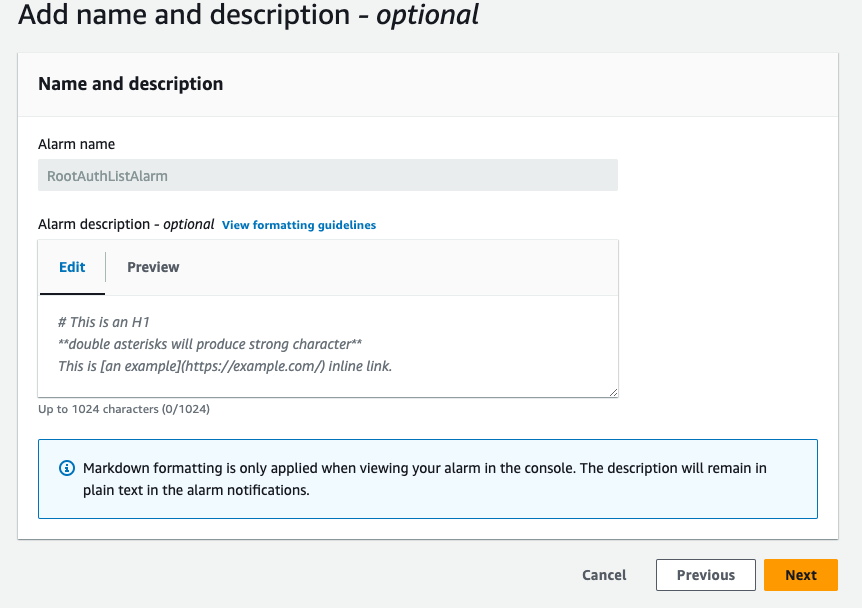
Now, when you create alarms in AWS, they initially show “insufficient data” until there is enough data to evaluate the alarm conditions. This process may take a few minutes as the system needs to collect the necessary data. To expedite this process and match our trigger pattern, we will execute the vault auth list command multiple times, generating logs that meet the criteria specified in our alarm. By doing so, we ensure that the alarm will be triggered and we can observe its behavior and actions.
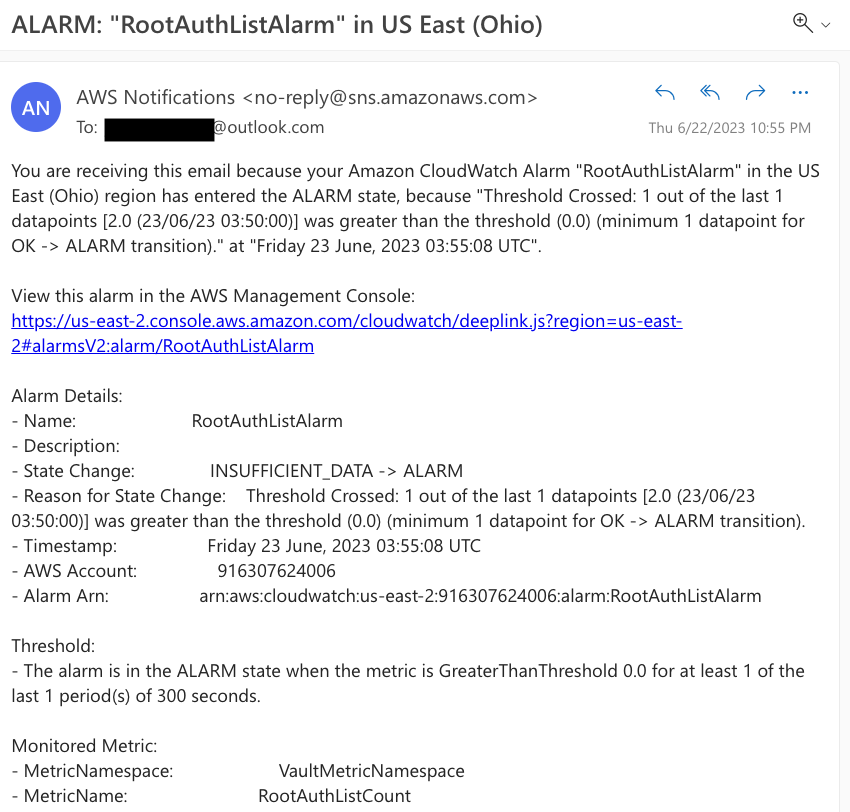
You can now observe that our alarm has entered the alarm state, indicating that it has successfully detected the expected pattern.

If you check your email, you will find a notification with the details of the alarm. This confirms that the metric and alarm we set up are functioning correctly.
Wrap-Up
In summary, logging and alerting with CloudWatch Logs provide a powerful and scalable solution for monitoring and analyzing your HashiCorp Vault logs. By integrating CloudWatch Logs with Vault, you can centralize your log data, gain valuable insights, and proactively respond to critical events.
You can utilize the same process described in this article to set up alerts for various patterns and events. Here are some examples of patterns you can monitor and alert on:
- Use of a root token: You can create a metric filter to detect when a root token is used and trigger an alarm.
- Creation of a new root token: Set up a metric filter to capture the creation of new root tokens and generate an alarm.
- Policy modification: Monitor policy modifications by configuring a metric filter for policy-related events and create corresponding alarms.
- Enabling a new auth method: Create a metric filter to track the enabling of new authentication methods and set up alarms accordingly.
- Permission denied events: Monitor permission denied events by defining a metric filter pattern and configure alarms to trigger when such events occur.
- Outside regular business hours: Use a metric filter to identify activities outside regular business hours and set up alarms to notify when detected.
- Seal status of Vault: Monitor the seal status of Vault using a metric filter and create alarms to alert if the seal status changes.
By following the steps outlined in this article, you can adapt the process to handle these patterns and events, and configure alarms to notify the respective recipients.
I hope this article has provided you with valuable insights on integrating Vault with CloudWatch Logs. By leveraging the capabilities of Vault and CloudWatch, you can enhance the security and monitoring of your systems. If you have any further questions or need clarification on any aspect of this article, please feel free to reach out to me. I’m more than happy to assist you and provide additional guidance. Your feedback and inquiries are always appreciated.
